

How are we doing?
This year the air quality indicator received a mixed rating. San Diego's air quality is shaped by local pollution emissions and regional conditions. Major sources of pollution include vehicle traffic, freight and shipping, and wildfire smoke. San Diego County had fewer poor air quality days overall in 2025 compared to 2024. However, the annual level of particulate matter increased to its highest level in 10 years and exceeded the EPA standard. In 2024, the region had 53.4 pediatric, asthma-related emergency visits per 10,000 children compared to California’s 60.7 visits. Climate change and rising temperatures increase the likelihood of unhealthy air quality caused by wildfire smoke. Wildfires in San Diego were more frequent in 2025-2025 than in 2023, but not as dangerous compared to historical seasons. Efforts to reduce air pollution and mitigating wildfires will improve public health and ensure that the San Diego region can enjoy better air quality.
Rating: Mixed Results
Some improvements alongside ongoing challenges of pollution and wildfires
Air quality index
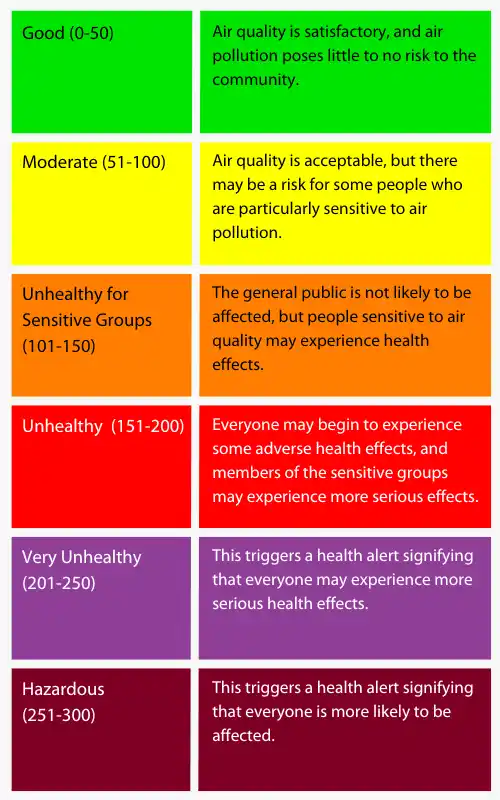
The U.S. Air Quality Index (AQI) has six categories, ranging from Good (0-50) to Hazardous (301+), indicating increasing levels of concern for poor air quality. The chart tracks the number of days in the year when air quality was rated as Unhealthy for Sensitive Groups (orange), Unhealthy (red), or Very Unhealthy (purple). Sensitive groups include, but are not limited to, individuals with lung disease, outdoor workers, children, and older adults. The general public is less likely to be affected by air quality rated as Unhealthy for Sensitive Groups, but should still exercise caution. Unhealthy air days can pose risks to the general public, while very unhealthy air days increase health risks for everyone.
San Diego County had fewer poor air quality days overall in 2025. Days rated as Unhealthy for Sensitive Groups dropped from 48 in 2024 to 26 in 2025, but Unhealthy air days rose from 0 to 7. There were no Very Unhealthy days in 2024 or 2025.
Children's asthma cases in the region
Poor air quality can significantly increase the risk of asthma attacks and related emergency department visits (see page 151 of CalEnviroScreen 4.0 Report). Rates of asthma-related pediatric emergency visits can also help identify communities where children may be more vulnerable to environmental pollution.
According to the California Department of Public Health, children under age 18 in San Diego County had 3,987 asthma-related emergency department visits in 2024, or 53.4 visits per 10,000 children. This rate was lower than California’s overall rate of 60.7 visits per 10,000 children. The highest rates were reported in Mission Valley (167.9 visits per 10,000 children), Lemon Grove (121.2), and South Park (118.8). The Policy and Innovation Center’s report on youth well-being in San Diego highlights the various ways children's health is shaped in part by their environment, underscoring the importance of reducing environmental hazards such as air pollution.
A closer look at particulate matter
PM2.5 (particulate matter) refers to miniscule particles or droplets that are suspended in the air, with a diameter about thirty times smaller than a strand of hair. In high concentrations, PM2.5 can be harmful to the respiratory tracts. Combustion of fuels (gasoline, oil, wood, etc) produces much of the PM2.5 pollution. Concentrations of PM2.5 can vary day to day because of multiple sources like traffic levels, wildfires, drought conditions, weather, and fireworks.
In 2025, the annual PM 2.5 was 11.9 g/m³ (micrograms per cubic meter). The federal standard for annual PM2.5 is 9.0 µg/m³. According to the American Lung Association’s National State of the Air Report Card, air quality in the San Diego region ranks poorly compared to other areas of the United States.
Understanding other aspects of air quality
The EPA sets National Ambient Air Quality Standards for six common pollutants: carbon monoxide, lead, nitrogen dioxide, ozone, particulate matter, and sulfur dioxide.
Wildfires
Fires occur naturally within Southern California’s native ecosystems, paring down excess growth, enriching the soil with nutrients, and even aiding in reproduction for some plants and insects. However, drought and warming temperatures have caused these fires to become more frequent and intense, preventing thorough recovery between fire incidents. Additionally, human development has expanded into wildlands, making communities and ecosystems susceptible to wildfires and poor air quality. It is estimated that 85% of wildland fires in the United States are caused by human activities.
Satellites play a significant role in understanding the extent and severity of wildfires. The Monitoring Trends in Burn Severity program provides data on wildfires that are greater than 1,000 acres. This map displays large wildfires that occurred in the San Diego region between 2001 and 2026. Though the region has not seen wildfires of this size since 2022, the risk of large wildfires increases as the climate warms.
Related Indicators
- Renewable Energy
- Electric Vehicles
- Outdoor Access
Alternatives to fossil fuels and gas-powered technology help us have a cleaner energy consumption, curbing the emissions of greenhouse gasses and toxic emissions.
Why is air quality important?
High quality of life means the region boasts a thriving economy and a healthy environment accessible to all in the community.
Economy
Poor air quality negatively impacts the economy by reducing labor productivity, increasing health expenditures, and causing crop yield losses. In California, the rising frequency and intensity of wildfires further strain the economy. These events damage infrastructure, crops, and water quality. Additionally, the heightened risk of wildfires has resulted in higher insurance premiums for homeowners.
Environment
Air quality is crucial due to the short- and long-term effects on public health. Air quality measurements reflect air pollution caused by industrial and commercial facilities and individual fossil fuel use, especially for transportation.
Wildfires are a natural part of San Diego’s ecology, but their increasing frequency in recent years is a growing concern for both residents and scientists. Smoke can spread to surrounding neighborhoods, harming the health of residents and local wildlife, significantly impacting short-term air quality over a wide area. Frequent wildfires can also damage habitats faster than they can recover.
Equity
People in urban communities are affected disproportionately by various public health issues such as air quality. Low-income and disadvantaged communities in California experience higher levels of air pollution and negative health effects compared to wealthier communities. These communities also often have higher proportions of people of color. For instance, freeways built directly through low-income neighborhoods expose residents of color to noise and air pollution, adversely affecting their health. The Barrio Logan neighborhood is an example and ranks among the top five most polluted areas in California.
Regional Response
Policies
On February 7, 2024, the EPA strengthened the National Ambient Air Quality Standard.The annual PM₂.₅ standard changed from 12 µg/m³ to 9 µg/m³ to reflect new scientific evidence revealing the serious effects of particulate matter on human health. This change holds many California counties to a tougher standard, including San Diego County.
The California Air Resources Board sets air quality standards that are often more protective than federal standards. However, not all counties meet federal standards for all pollutants. The 2026 Extreme Ozone SIP Revision is a statewide plan designed to help the state attain federal ozone standards.
Rules and regulations by the San Diego County Air Pollution Control District (SDCAPD) can be viewed online.
Projects
The San Diego County Air Pollution Control District’s Office of Environmental Justice leads efforts to reduce community exposure to pollutants. The prioritized communities are Portside Communities and International Border Communities.
The Metropolitan Transit System’s Zero Emissions Bus Program plans to fully transition to zero emission buses by 2040.
The Rooted in Communidad, Cultivating Equity (RICCE) initiative aims to improve air quality, improve road safety, and implement urban greenery in the Barrio Logan, Logan Heights, Sherman Heights, Shelltown, Stockton, Grant Hill, Mount Hope, and Southcrest neighborhoods.
Partnerships
San Diegans come together each year to participate in Clean Air Day which is supported by numerous government agencies, including San Diego Gas & Electric, The San Diego Foundation, San Diego Association of Governments (SANDAG) and many more organizations and community leaders.
The San Diego-Tijuana Air Quality Task Force is a binational initiative for developing measures to improve air quality in the border region.
What are we tracking?
We report air quality by tracking the number of days when San Diego County’s air is considered unhealthy or very unhealthy for the total population as well as when it is unhealthy for sensitive groups as recorded in the EPA Air Quality Index Report. Air pollution levels measured at a particular monitoring site are not necessarily representative of the air quality for an entire county or urban area. We also measure children’s asthma hospitalization rates by ZIP code throughout the county and report on those areas with 5 or more events. For air pollutants, we specifically focus on annual average PM 2.5 levels in the county.